
Understanding the true impact of content marketing is crucial for justifying budgets and optimizing strategies. This article details the essential metrics for measuring Content Marketing ROI in 2025, covering core categories like organic traffic and conversions, advanced attribution techniques with UTM parameters and multi-touch models, and practical methods for calculating monetary business impact. It also explores how platforms like Articfly can automate and enhance this measurement process, culminating in a clear action plan for effective ROI tracking.
- The Content Marketing ROI Challenge
- The Core ROI Metrics Framework
- Setting Up Attribution with UTM Parameters
- Advanced Tracking and Multi-Touch Attribution
- Calculating Actual ROI and Business Impact
- Articfly Integration: Automating ROI Measurement
- Action Plan for Measuring Content ROI
The Content Marketing ROI Challenge
In the dynamic landscape of digital marketing, a question frequently echoes through executive boardrooms and startup huddles: "Is our content really paying off?" This query is not merely rhetorical; it represents a fundamental challenge for marketing professionals. Demonstrating the tangible return on investment (ROI) for content marketing initiatives is not just advantageous—it is imperative for budget justification, strategic planning, and overall business growth, particularly for agile agencies and burgeoning startups.
The demand for data-driven decision-making has never been higher, especially as we advance into 2025. Marketers are under increasing pressure to move beyond vanity metrics and provide clear, quantifiable evidence of how content contributes to the bottom line. Without a robust framework for measuring content marketing ROI, investments risk being perceived as unproven expenditures rather than strategic assets driving revenue and brand equity.
Numerous studies underscore the effectiveness of content marketing. For instance, statistics consistently show that content marketing generates approximately three times as many leads as traditional outbound marketing, and costs 62% less. Furthermore, companies that blog receive 97% more links to their websites. Despite these compelling figures, a significant gap often exists in measurement capabilities. Many organizations invest heavily in content creation but lack the precise tools and methodologies to attribute specific business outcomes directly to their content efforts. This deficiency prevents them from optimizing strategies, allocating resources effectively, and ultimately, proving the value of their work to stakeholders.
Demonstrating the tangible return on investment for content marketing initiatives is not just advantageous—it is imperative for budget justification, strategic planning, and overall business growth.
Closing this measurement gap is critical. It involves moving beyond basic traffic reports to a sophisticated understanding of how each piece of content influences user behavior, drives conversions, and contributes to revenue. This article will delineate the essential metrics and advanced techniques required to accurately measure content marketing ROI, empowering agencies and startups to make informed, impactful decisions in 2025.

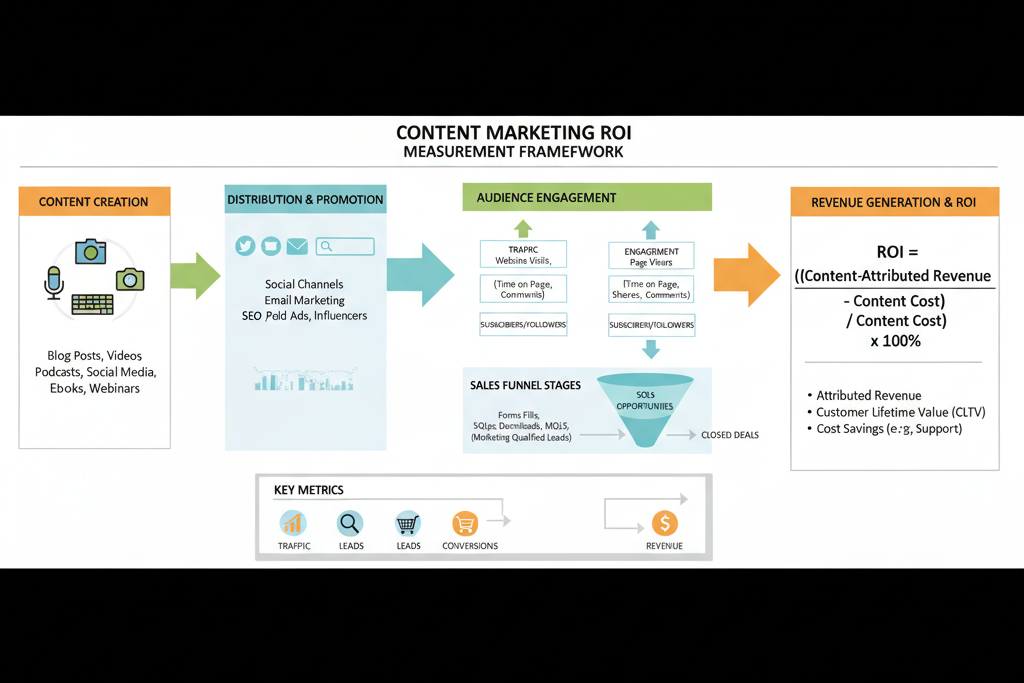
The Core ROI Metrics Framework
To accurately measure content marketing ROI, a comprehensive framework encompassing several key metric categories is essential. Each category provides specific insights into how content performs across the customer journey, from initial awareness to final conversion. Here are the five essential metric categories:
Organic Traffic Growth and Quality
Organic traffic represents visitors who find your content through search engines. Measuring its growth involves tracking the number of unique visitors and page views from organic search over time. Quality is equally important; this includes metrics like bounce rate, pages per session, and average session duration for organic visitors. A high bounce rate or short session duration for organic traffic indicates that while people are finding your content, it may not be meeting their expectations or search intent effectively.
- Metric: Organic Sessions/Users, Organic Page Views
- Calculation Example: Track organic sessions month-over-month in Google Analytics. If January had 10,000 organic sessions and February had 12,000, that’s a 20% growth.
- Benchmarks: Aim for a consistent month-over-month growth of 5-15%, with organic bounce rates typically under 70% and pages per session above 1.5.
Conversion Rate Optimization from Blog Visitors
This category focuses on the percentage of blog visitors who complete a desired action, such as subscribing to a newsletter, requesting a demo, or making a purchase. Conversion rate optimization (CRO) from blog content demonstrates its direct business impact. It requires clear calls-to-action (CTAs) within your content and proper tracking setup.
- Metric: Blog-to-Lead Conversion Rate, Blog-to-Sale Conversion Rate
- Calculation Example: (Number of conversions from blog posts / Total unique blog visitors) * 100. If 100 conversions occur from 5,000 blog visitors, the conversion rate is 2%.
- Benchmarks: Conversion rates vary widely by industry and goal, but 1-5% is a common range for initial lead generation from content.
Lead Generation Metrics
Content marketing is a powerful engine for lead generation. This category tracks the quantity and quality of leads generated directly or indirectly by your content. Specific metrics include form sign-ups for gated content (eBooks, whitepapers), webinar registrations, and inquiries originating from content pages.
- Metric: Number of Content-Generated Leads, Cost Per Lead (CPL)
- Calculation Example: Track all form submissions where the referrer was a blog post. CPL = Total content marketing spend / Number of content-generated leads.
- Benchmarks: Target a decreasing CPL over time as content scales and optimizes. Lead volume should correlate with content output and distribution efforts.
Engagement Time and Depth Metrics
These metrics assess how deeply users interact with your content. Beyond simple page views, engagement time (average time on page) and depth (scroll depth, clicks on internal links, video plays) indicate content quality and user interest. High engagement suggests that content is valuable and holds audience attention, contributing to better organic rankings and brand perception.
- Metric: Average Time on Page, Scroll Depth, Internal Link Clicks
- Calculation Example: Google Analytics provides average time on page. Scroll depth can be measured using Google Tag Manager.
- Benchmarks: Aim for average time on page above 2-3 minutes for detailed articles, and significant scroll depth (e.g., 75% or more) for most visitors.
Brand Awareness Metrics
While often harder to quantify monetarily, brand awareness is a critical long-term outcome of content marketing. This category includes metrics like social shares, brand mentions (on social media, forums, news sites), and backlinks. Backlinks, especially from authoritative domains, are particularly valuable as they boost domain authority and organic search visibility.
- Metric: Social Shares, Brand Mentions, Number of Backlinks, Referring Domain Growth
- Calculation Example: Use social media analytics tools for shares and mentions. SEO tools like Ahrefs or SEMrush track backlinks and referring domains.
- Benchmarks: Consistent growth in all these areas signifies expanding brand reach and authority. Aim for a diverse backlink profile from relevant, high-authority sites.
Setting Up Attribution with UTM Parameters
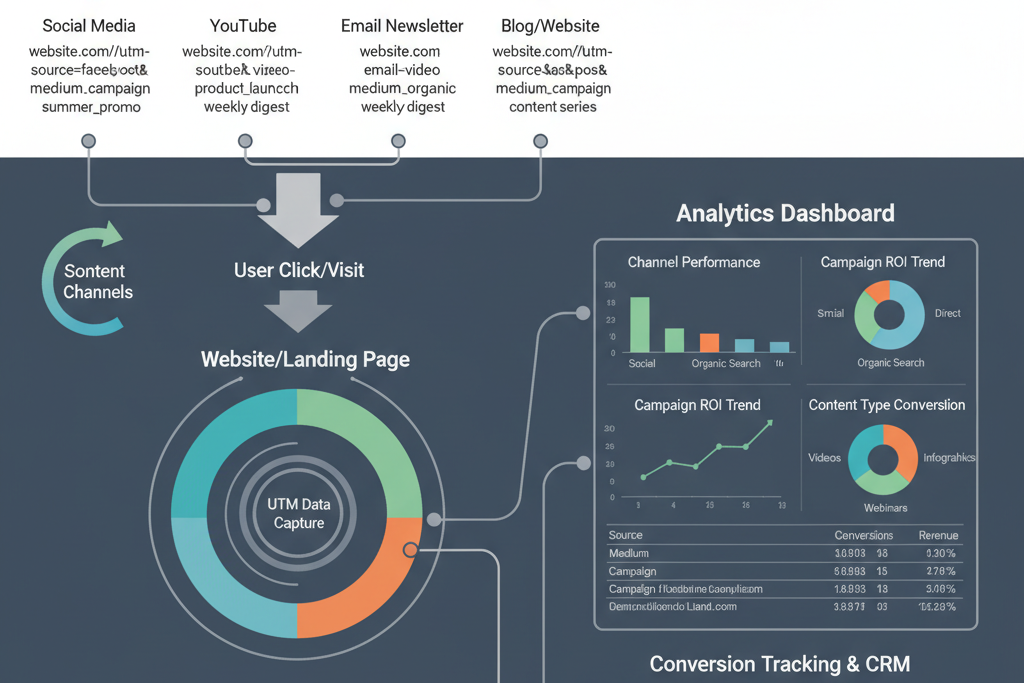
Effective attribution is the cornerstone of content marketing ROI measurement in 2025. Without knowing where your traffic and conversions originate, it's impossible to optimize your efforts. UTM (Urchin Tracking Module) parameters are essential tags you can add to URLs, allowing you to track the source, medium, and campaign of your website traffic in analytics platforms like Google Analytics 4 (GA4).
UTM Parameter Fundamentals
UTM parameters are simple pieces of code appended to the end of a URL. When a user clicks a link with UTM parameters, these parameters send data back to your analytics platform, providing crucial context about how the user arrived at your site. There are five standard UTM parameters:
utm_source: Identifies the source of the traffic (e.g., facebook, newsletter, google, linkedin).utm_medium: Identifies the medium used (e.g., cpc, organic, email, social, banner).utm_campaign: Identifies a specific campaign or promotion (e.g., summer_sale, new_ebook_promo).utm_term(Optional): Identifies paid search keywords (primarily for PPC campaigns).utm_content(Optional): Differentiates similar content within the same ad or link (e.g., textlink, banner_v2).
Specific Examples of UTM Usage
Consider a scenario where you publish a new blog post titled "Top 10 AI Tools for Marketers" and promote it across various channels:
- Email Newsletter:
https://yourdomain.com/blog/ai-tools?utm_source=newsletter&utm_medium=email&utm_campaign=ai_tools_promo&utm_content=hero_banner - LinkedIn Post:
https://yourdomain.com/blog/ai-tools?utm_source=linkedin&utm_medium=social&utm_campaign=ai_tools_promo&utm_content=post_textlink - Guest Post on a Partner Site:
https://yourdomain.com/blog/ai-tools?utm_source=partnersite&utm_medium=referral&utm_campaign=ai_tools_promo
These examples illustrate how specific naming conventions provide granular insights into performance across different channels and within campaigns.
Best Practices for Naming Conventions and Consistency
Consistency is paramount for effective UTM tracking. Without it, your data will be fragmented and unreliable. Establish clear guidelines for your team:
- Use lowercase consistently:
facebooknotFacebookorFACEBOOK. GA4 treats these as separate sources. - Use underscores or hyphens: For multi-word terms, use
new_ebook_promoornew-ebook-promo, not spaces. - Be specific and descriptive: Generic names like
socialare less useful thanlinkedin_organicorfacebook_paid. - Document your conventions: Maintain a shared spreadsheet or internal document outlining all approved UTM values for sources, mediums, and campaigns.
- Test your URLs: Before launching, click your UTM-tagged links and verify that the parameters appear correctly in your analytics reports.
Implementing UTM Tracking in Google Analytics 4
GA4 automatically processes UTM parameters. Once tagged URLs are clicked, the data populates various reports:
- Acquisition Reports: Navigate to "Reports" > "Acquisition" > "Traffic acquisition" or "User acquisition."
- Dimensions: You can apply dimensions like "Session source," "Session medium," "Session campaign," and "Session source / medium" to see how different UTM values are performing.
- Custom Reports: For more detailed analysis, create custom reports or explore within GA4's "Explorations" section, utilizing these dimensions and relevant metrics (e.g., conversions, engagement rate).
By diligently applying UTM parameters, you gain the granular data necessary to understand which specific content pieces, promoted on which channels, are driving the most valuable traffic and conversions. This empowers true data-driven optimization of your content marketing budget and strategy.
Advanced Tracking and Multi-Touch Attribution
While UTM parameters provide foundational insights, the journey to comprehensive ROI measurement necessitates advanced tracking methods and a sophisticated understanding of multi-touch attribution. Modern customer journeys are rarely linear; users interact with multiple pieces of content and touchpoints before converting. Advanced techniques help unravel this complexity.
Understanding Multi-Touch Attribution Models
Multi-touch attribution models distribute credit for a conversion across all touchpoints a user interacted with. Different models offer varying perspectives:
- First-Touch Attribution: Assigns 100% of the credit to the first marketing touchpoint a customer encountered. Useful for understanding initial awareness and lead generation.
- Last-Touch Attribution: Assigns 100% of the credit to the final marketing touchpoint before conversion. Simple to implement but often undervalues earlier touchpoints.
- Linear Attribution: Distributes credit equally across all touchpoints in the conversion path. Provides a balanced view but may not reflect actual impact.
- Time-Decay Attribution: Gives more credit to touchpoints that occurred closer in time to the conversion. Assumes recent interactions are more influential.
- U-Shaped (Position-Based) Attribution: Assigns 40% credit to both the first and last interactions, with the remaining 20% distributed evenly among middle interactions. Balances initial discovery with final conversion drivers.
- Data-Driven Attribution: Utilizes machine learning to algorithmically distribute credit based on actual data from your account. This is often the most accurate model, as it learns from your specific customer journeys. GA4 defaults to a data-driven model.
Choosing the right model depends on your business goals. For content marketing, a model that acknowledges the nurturing aspect (like linear or time-decay) or the full journey (data-driven) can be more insightful than just first- or last-touch.
Server-Side Tracking
In an era of increasing privacy concerns and browser limitations (e.g., Intelligent Tracking Prevention), client-side tracking (browser-based cookies) faces challenges. Server-side tracking offers a more robust solution by moving the data collection process from the user's browser to your server. This means data is sent directly from your server to analytics platforms, improving data accuracy, enhancing security, and reducing the impact of ad blockers and cookie restrictions.
For content marketers, server-side tracking ensures more reliable data capture for views, interactions, and conversions, even when traditional methods are hampered. It provides a more complete picture of how users engage with your content assets.
CRM Integration
Integrating your analytics platform (like GA4) with your Customer Relationship Management (CRM) system (e.g., Salesforce, HubSpot) is crucial for a full-funnel view of content ROI. This integration links anonymous website behavior with known customer data, allowing you to:
- Track leads generated by specific content pieces all the way through the sales pipeline.
- Attribute actual revenue to content touchpoints.
- Understand the customer lifetime value (CLTV) of leads acquired through content.
- Segment your audience based on content consumption and CRM data for more personalized nurturing.
By connecting content engagement to sales outcomes, you can precisely quantify the business impact of your content strategy.
Privacy-Compliant Tracking Methods
With regulations like GDPR and CCPA, privacy-compliant tracking is non-negotiable. Strategies include:
- Consent Management Platforms (CMPs): Implement robust CMPs that allow users to manage their cookie preferences.
- Cookieless Tracking: Explore privacy-preserving tracking methods that do not rely on cookies, such as fingerprinting (with caution and transparency) or first-party data collection with explicit consent.
- Data Minimization: Collect only the necessary data points required for your analysis.
- Anonymization: Anonymize IP addresses and other identifiers where possible.
Integrating your analytics platform with your Customer Relationship Management (CRM) system is crucial for a full-funnel view of content ROI, linking anonymous website behavior with known customer data.
Maintaining trust with your audience through transparent and compliant data practices is fundamental, ensuring that your tracking efforts are sustainable and ethical.
Real-World Attribution Challenges and Solutions
Challenge: Long Sales Cycles: For B2B companies, a single blog post might initiate a journey that takes months to convert. Solution: Implement time-decay or data-driven attribution models and integrate CRM data to track content's influence over the entire cycle.
Challenge: Dark Social & Offline Interactions: Content shared via messaging apps or discussed offline is hard to track. Solution: Encourage shareable content with clear CTAs, use unique landing pages, and leverage surveys to ask customers "How did you hear about us?"
By embracing these advanced tracking and attribution methods, content marketers can move beyond superficial metrics to gain deep, actionable insights into the true ROI of their efforts, ultimately justifying budgets and refining strategies for maximum business impact.

Calculating Actual ROI and Business Impact
With robust tracking and attribution in place, the next critical step is to translate content performance into clear financial metrics. Calculating the actual ROI of your content marketing requires assigning monetary value to your content-driven outcomes and comparing it against your investment.
Formulas and Methods for Content Marketing ROI
The fundamental ROI formula is: ROI = (Net Profit / Total Investment) * 100.
For content marketing, this translates to:
Content Marketing ROI = (Revenue Attributed to Content - Content Marketing Costs) / Content Marketing Costs * 100
Content Marketing Costs include:
- Content creation (salaries, freelance writers, tools like Articfly)
- Content promotion (paid ads, distribution platforms)
- Analytics and tracking tools
- Opportunity cost of time spent
Assigning Monetary Value to Leads
Not every lead directly results in a sale, but leads hold significant potential value. To assign monetary value:
- Determine your Lead-to-Customer Conversion Rate: If 10% of your leads become customers, and your average customer value is $1,000, then each lead is potentially worth $100.
- Calculate Average Customer Value (ACV): This is the average revenue generated per customer.
- Value of a Lead = ACV * Lead-to-Customer Conversion Rate.
If your content generates 50 qualified leads in a month, and each lead is valued at $100, your content has generated $5,000 in potential revenue.
Calculating Customer Lifetime Value (CLTV) from Content
CLTV represents the total revenue a business expects to earn from a single customer over their entire relationship. Content often plays a crucial role in nurturing leads and retaining customers, directly impacting CLTV.
- CLTV Formula (Simplified):
(Average Purchase Value * Average Purchase Frequency) * Average Customer Lifespan
To specifically attribute CLTV to content: segment customers based on their acquisition path. Compare the CLTV of customers who initially engaged with your content (e.g., downloaded an eBook, read a specific blog series) versus those acquired through other channels. If content-acquired customers have a higher CLTV, it demonstrates the long-term strategic value of your content efforts.
Demonstrating Revenue Attribution
This is where multi-touch attribution models shine. By using a data-driven model in GA4 or through CRM integration, you can see precisely how much revenue is attributed to different content pieces or content categories. For example:
- A product review blog post might receive 30% credit for a direct sale.
- An educational article series might receive 15% credit for leads that eventually convert months later.
Regularly generate reports showing revenue contributions from your blog, gated content, or specific campaigns. This moves the conversation from "how many views?" to "how much revenue did it generate?"
Creating ROI Dashboards and Reports for Stakeholders
To effectively communicate ROI, present your findings in clear, concise dashboards and reports. Key elements include:
- Key Metrics: Organic traffic growth, content-generated leads, conversion rates.
- Financial Impact: Total attributed revenue, content marketing ROI percentage, CPL (Cost Per Lead).
- Visualizations: Graphs showing trends over time, pie charts for attribution distribution.
- Narrative: Explain the insights and strategic implications of the data. Highlight successful campaigns and areas for improvement.
Tools like Google Looker Studio (formerly Data Studio), CRM dashboards, or custom BI solutions can integrate data from GA4, your CRM, and other sources to create a unified view. Presenting this information regularly and consistently ensures that all stakeholders understand the financial contribution of content marketing.

Articfly Integration: Automating ROI Measurement
In the quest for efficient and measurable content marketing, automation platforms like Articfly offer significant advantages, especially when integrated with your ROI measurement workflows. Articfly's AI-powered content creation platform is designed to produce professional, SEO-optimized blog articles automatically, which directly supports and enhances accurate ROI tracking.
Automated Content Generation and UTM Implementation
Articfly streamlines content creation, enabling businesses to generate a high volume of quality articles quickly. This automation facilitates consistent UTM implementation:
- Standardized Content Output: By generating articles based on predefined templates and SEO best practices, Articfly ensures that key elements for tracking, such as clear CTAs and potential linking opportunities, are consistently present.
- Scalable Tracking Setup: As Articfly helps scale content production, it becomes simpler to apply consistent UTM parameters across all new articles. A robust content strategy built on Articfly can incorporate a standardized tagging process from the outset, ensuring every new piece of content is trackable.
- Reduced Manual Error: Manual content creation and promotion often lead to inconsistent UTM tagging. Articfly's automated approach, when combined with a defined content distribution strategy, minimizes these errors, ensuring cleaner data for analysis.
How Quality Content Improves Conversion Metrics
Articfly's proprietary AI system analyzes search intent, applies SEO best practices, and produces engaging, data-driven articles. This commitment to quality directly impacts conversion metrics:
- Improved Organic Rankings: SEO-optimized content leads to higher visibility in search results, driving more qualified organic traffic to your articles. More relevant visitors translate to a higher likelihood of conversion.
- Enhanced Engagement: High-quality, well-structured content keeps readers engaged longer, increasing average time on page and scroll depth. Engaged users are more likely to interact with CTAs and move further down the sales funnel.
- Stronger Lead Nurturing: By consistently providing valuable information, Articfly-generated content builds trust and authority. This pre-qualifies leads, making them more receptive to offers and improving conversion rates for gated content or product pages.
- Reduced Bounce Rates: Content tailored to user intent, as Articfly aims to produce, ensures visitors find what they are looking for, reducing bounce rates and indicating higher content quality.
Scaling Content While Maintaining Measurable Results
Articfly's mission is to empower content teams with automation, making high-quality content production effortless and scalable. This scalability is critical for ROI measurement:
- Efficient A/B Testing: With the ability to rapidly generate variations of content or CTAs, Articfly enables efficient A/B testing, allowing marketers to quickly identify what resonates best with their audience and drives conversions.
- Broader Keyword Coverage: Articfly helps create content for a wider array of long-tail keywords, expanding your organic footprint and reaching niche audiences that might be highly convertible. Each new piece of content offers a new data point for ROI analysis.
- Consistent Reporting: By automating the content creation process, you create a steady stream of measurable assets. This consistency simplifies the process of establishing baselines, tracking progress, and generating consistent ROI reports over time.
By integrating Articfly into your content strategy, you not only save time and reduce costs in content creation but also establish a more robust and consistent foundation for measuring the true ROI of your content marketing efforts, transforming ideas into engaging, data-driven articles with measurable impact.

Action Plan for Measuring Content ROI
Establishing a robust system for measuring content marketing ROI does not have to be an overwhelming endeavor. By following a structured 30-day implementation plan, agencies and startups can quickly set up foundational tracking, establish performance baselines, and begin demonstrating tangible value.
30-Day Implementation Plan for Content Marketing ROI Measurement
- Week 1: Define Goals and Audit Current State
- Day 1-2: Clearly define your content marketing goals (e.g., increase organic leads by X%, improve blog-to-conversion rate by Y%).
- Day 3-5: Conduct an audit of existing content. Identify what's currently tracked and what's missing. Review your Google Analytics 4 setup.
- Day 6-7: Document your current content marketing budget and allocate costs for the next reporting period.
- Week 2: Implement UTM Tracking and Baseline Metrics
- Day 8-10: Establish clear UTM naming conventions. Create a shared documentation guide for your team.
- Day 11-14: Begin implementing UTM parameters on all new content distribution links (social media, emails, guest posts, paid promotions). Retroactively apply to key evergreen content if feasible.
- Day 15-16: Collect baseline data for your core ROI metrics (organic traffic, conversion rates, engagement) from the previous 1-3 months. This will be your starting point for comparison.
- Week 3: Set Up Reporting Framework and Attribution
- Day 17-19: Configure custom reports or "Explorations" in Google Analytics 4 to track content performance using your new UTM parameters.
- Day 20-22: If not already done, integrate your CRM with GA4 to link content engagement data with lead and customer information.
- Day 23-24: Select an appropriate multi-touch attribution model within GA4 (consider Data-Driven or Time-Decay for content). Understand how it will allocate credit.
- Week 4: Calculate ROI and Plan Continuous Optimization
- Day 25-27: Use the collected data to perform your initial ROI calculation. Assign monetary values to leads and conversions where possible.
- Day 28-29: Create a simple ROI dashboard or report for stakeholders, highlighting key metrics, financial impact, and initial insights.
- Day 30: Schedule regular (e.g., monthly) reviews of your content performance and ROI. Plan for continuous optimization based on insights, adjusting content strategy, promotion tactics, and CTAs.
Measuring content marketing ROI is an ongoing process of data collection, analysis, and refinement. By embracing a data-driven approach and leveraging the tools and techniques outlined, agencies and startups can confidently demonstrate the financial impact of their content efforts, justify investments, and continuously improve their strategies for sustainable growth.

Mastering content marketing ROI is no longer optional; it's a fundamental requirement for strategic growth. By diligently tracking the right metrics, implementing robust attribution models, and leveraging platforms that streamline content creation and measurement, agencies and startups can move beyond guesswork and demonstrate concrete business value. Start implementing these measurement strategies today to transform your content from a cost center into a powerful revenue driver.