
Why Executive SEO Dashboards Matter in 2026

Strategic executive-level reporting has become the cornerstone of digital success in the rapidly evolving search landscape of 2026. As AI-driven search becomes the norm, stakeholders require a clear connection between technical organic performance and overarching business outcomes. Referencing Articfly’s "Why AI-Driven Content Matters" research demonstrates that automation allows teams to shift focus from manual data entry to high-level strategic oversight.
"Executive leaders must shift from tracking raw traffic to measuring the strategic influence of search on the customer journey by 2026," according to a recent Gartner report.
Aligning SEO with Business Goals
Modern SEO strategies must map key performance indicators directly to revenue, lead generation, and brand awareness to maintain executive support. Utilizing an OKR framework ensures that every search initiative supports a specific, measurable corporate objective. This clarity allows teams to justify budgets and scale content programs according to the Search Engine Journal 2025 outlook.
Real-time Decision Making
Monthly reports are no longer sufficient for fast-moving markets that demand live data access for immediate pivots. Live dashboards enable teams to respond to algorithm changes or competitor moves through automated alerts. This agility ensures that search performance remains stable and provides a competitive advantage in volatile digital environments.
Core Metrics Every Executive Dashboard Should Track
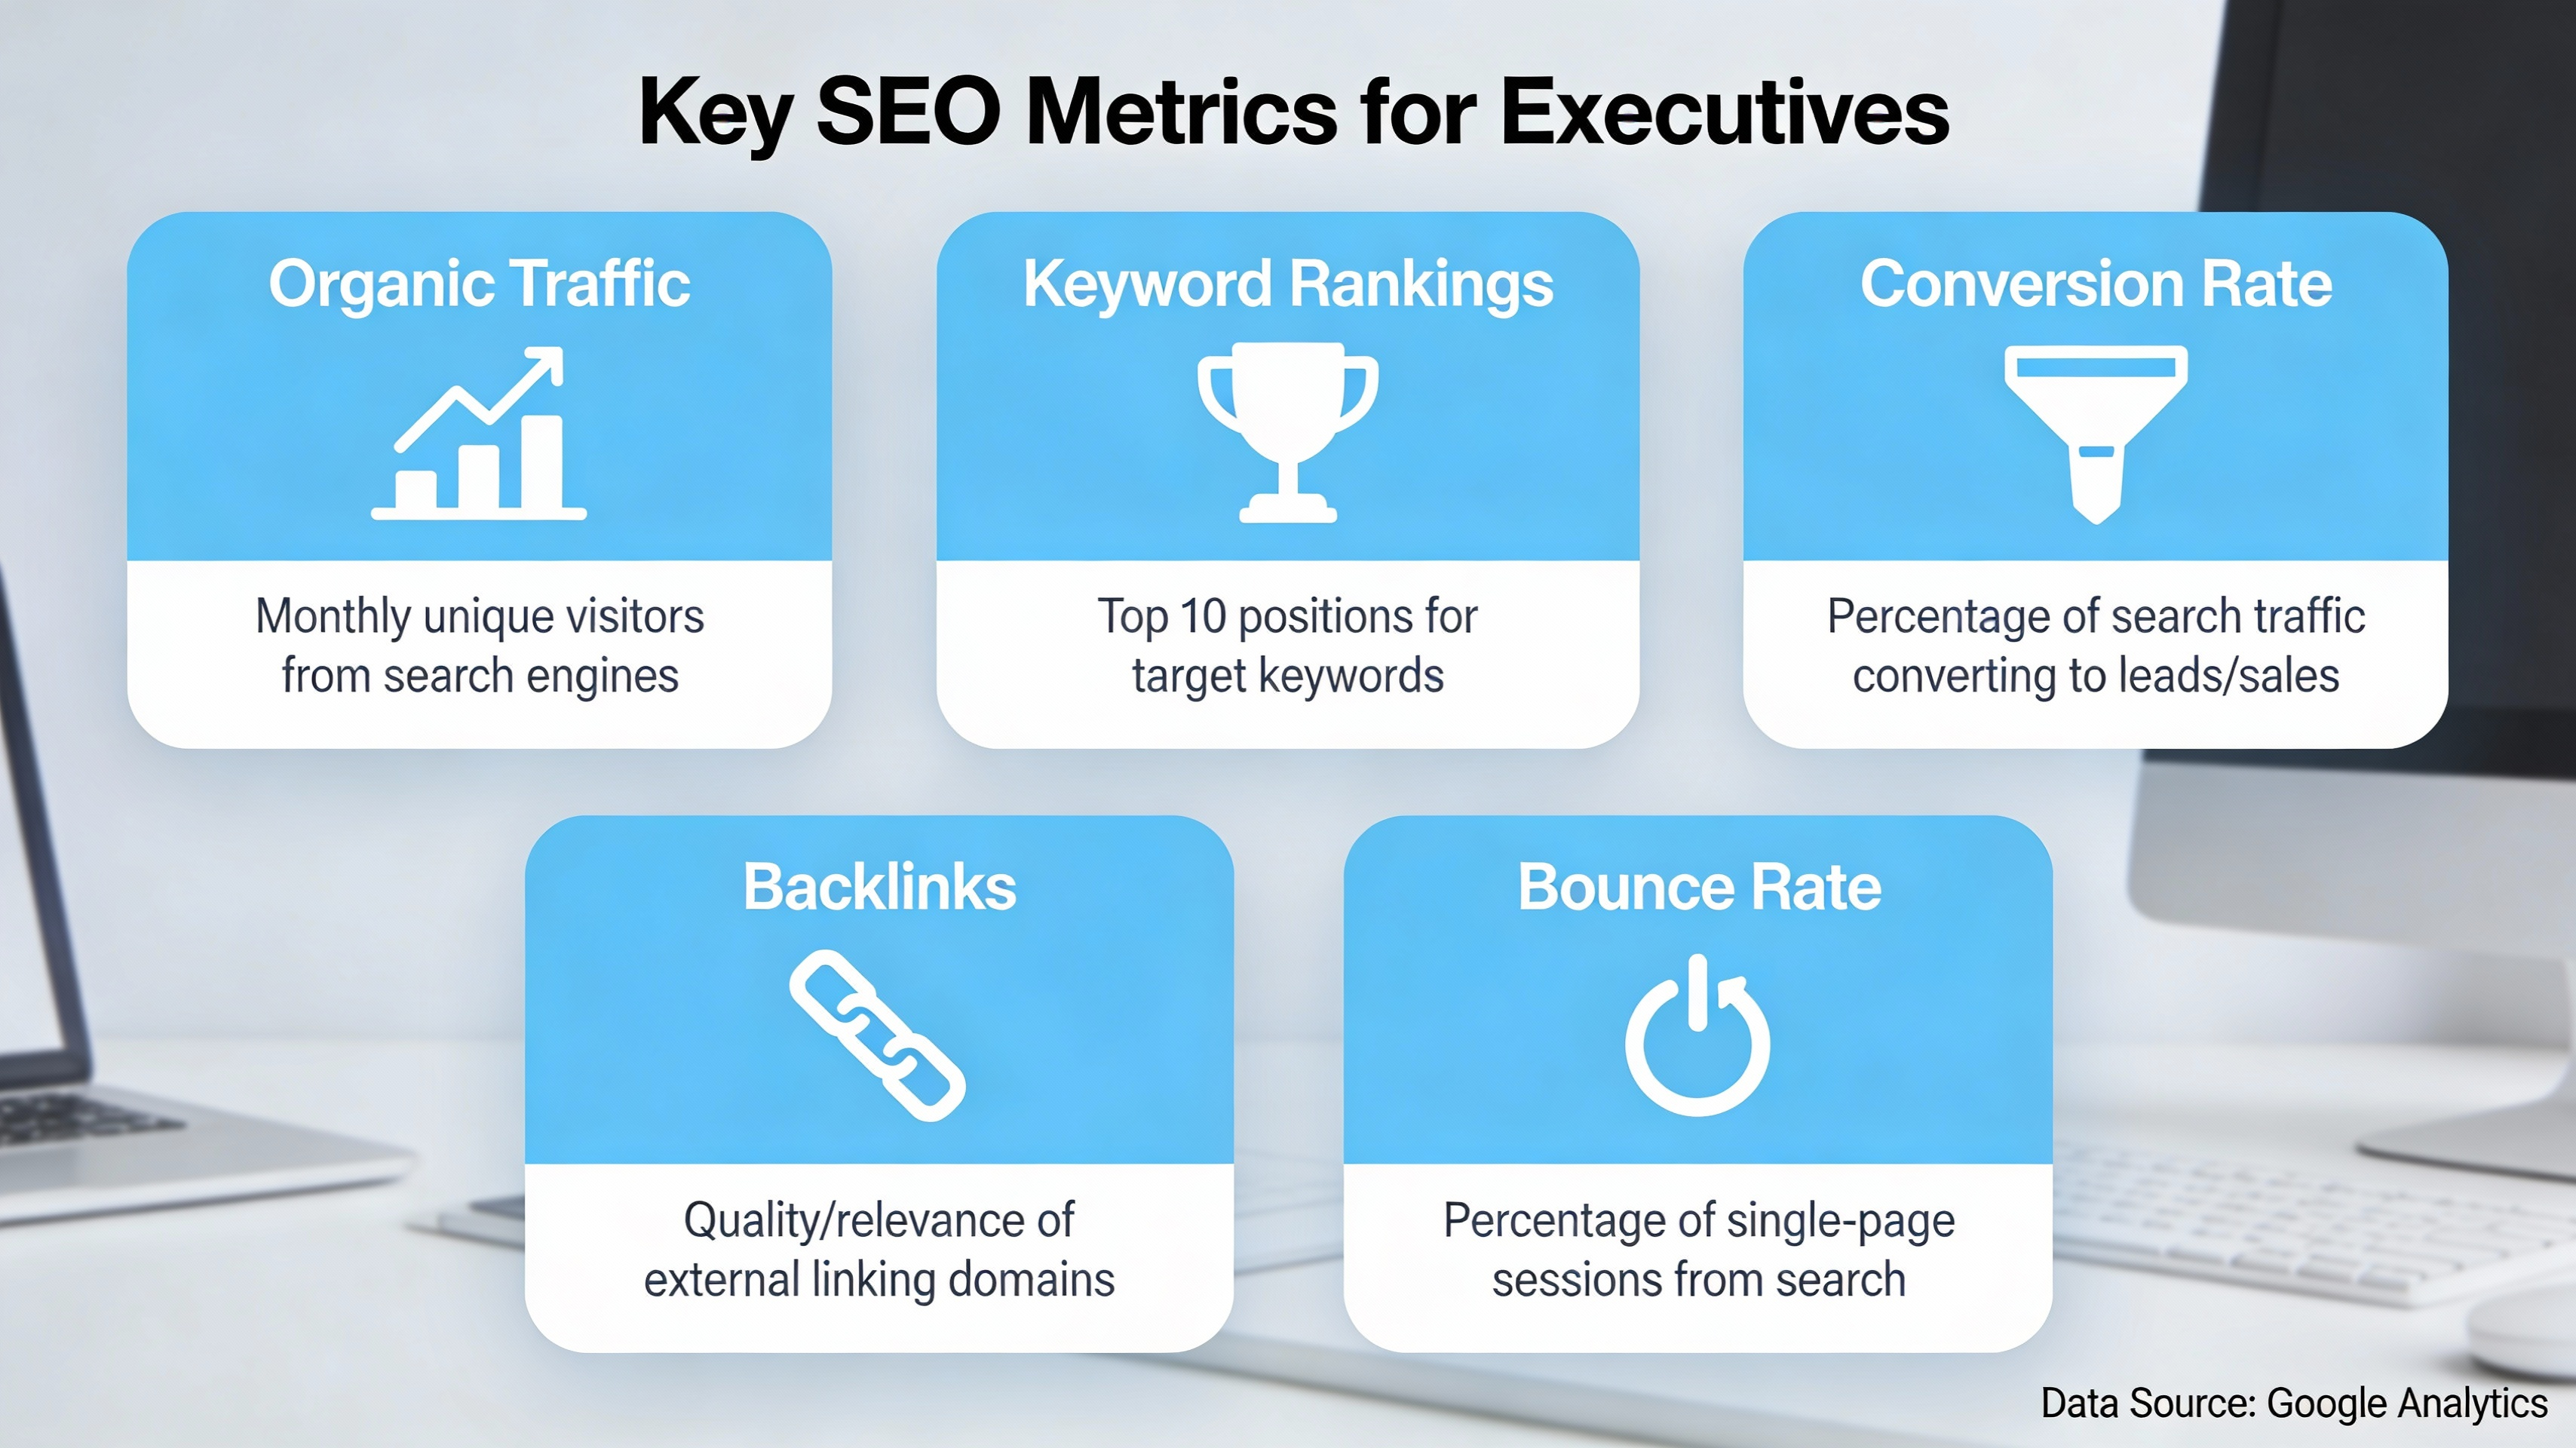
Essential data points provide the immediate proof needed to demonstrate the return on investment for all organic search activities. To satisfy executive requirements, dashboards must move beyond vanity metrics to focus on visibility scores and conversion attribution. Integrating Articfly’s metric library helps teams identify which high-level indicators resonate most with stakeholders as suggested by Moz’s guide on SEO KPIs.
| Metric Category | Business Impact |
|---|---|
| Organic Traffic Trends | Brand reach and market demand signals. |
| Keyword Visibility | Competitive share of voice in target segments. |
| Conversion Attribution | Direct contribution to pipeline and revenue. |
| ROI Calculation | Efficiency of marketing spend vs. organic gains. |
Organic Traffic & Growth Trends
Segmenting traffic by channel, device, and geography provides a granular view of where the most valuable users are originating. This data allows executives to see the health of the organic funnel across different market segments. Visualizing these trends helps in predicting future growth patterns based on historical performance.
Keyword Rankings & Visibility
Visualizing ranking distribution across top positions gives a clear picture of search engine dominance. A visibility score aggregates these rankings into a single percentage, making it easier for non-technical stakeholders to understand market share. This high-level view simplifies complex ranking data into an actionable competitive metric.
Conversion Attribution from SEO
Measuring the direct impact of search requires a focus on both assisted conversions and multi-touch attribution models. This approach proves that SEO often initiates the customer journey even if the final click happens elsewhere. By capturing this data, marketing directors can demonstrate the true value of content at every stage of the funnel.
ROI & Revenue Impact
Calculating the financial return of organic search involves comparing the cost of content production against the revenue generated from organic leads. A formulaic approach should be established using specific client data to ensure accuracy and transparency. This metric is often the most critical for C-level executives when determining future resource allocation.
Designing the Dashboard Layout for Instant Insights
Effective visual design ensures that critical information is communicated instantly without the need for deep technical analysis. Prioritizing data that appears above-the-fold allows executives to grasp the current status of SEO performance in seconds. Following Articfly’s UI/UX best practices and principles from the Nielsen Norman Group creates a more intuitive reporting experience.
Choosing the Right Visualization Types
Selecting the appropriate chart type is vital for accurately representing different data sets within the dashboard. Bar charts are ideal for comparing keyword rankings, while line graphs effectively illustrate long-term traffic trends. Heatmaps can be utilized to show geographic concentrations of user engagement or search visibility.
Tables vs. Charts vs. Heatmaps
- Charts: Best for identifying trends and anomalies over time at a glance.
- Tables: Useful for providing detailed lists of high-performing pages or specific keywords.
- Heatmaps: Excellent for visualizing geographic performance and user behavior density.
Prioritizing Above-the-Fold Data
The top section of the dashboard should strictly contain the top three metrics every executive needs to see immediately upon opening the report. Typically, these include total organic revenue, month-over-month traffic growth, and the overall visibility score. Keeping this area clean and focused prevents information overload and ensures the most important data is never missed.
Interactive Filters and Drill-Downs
Interactive filters empower stakeholders to perform their own deeper analysis without cluttering the main view of the dashboard. Executives can toggle between different regions, product categories, or timeframes to see specific performance subsets. This functionality provides flexibility while maintaining a high-level summary for general review.
Building the Dashboard with AI-Powered Tools
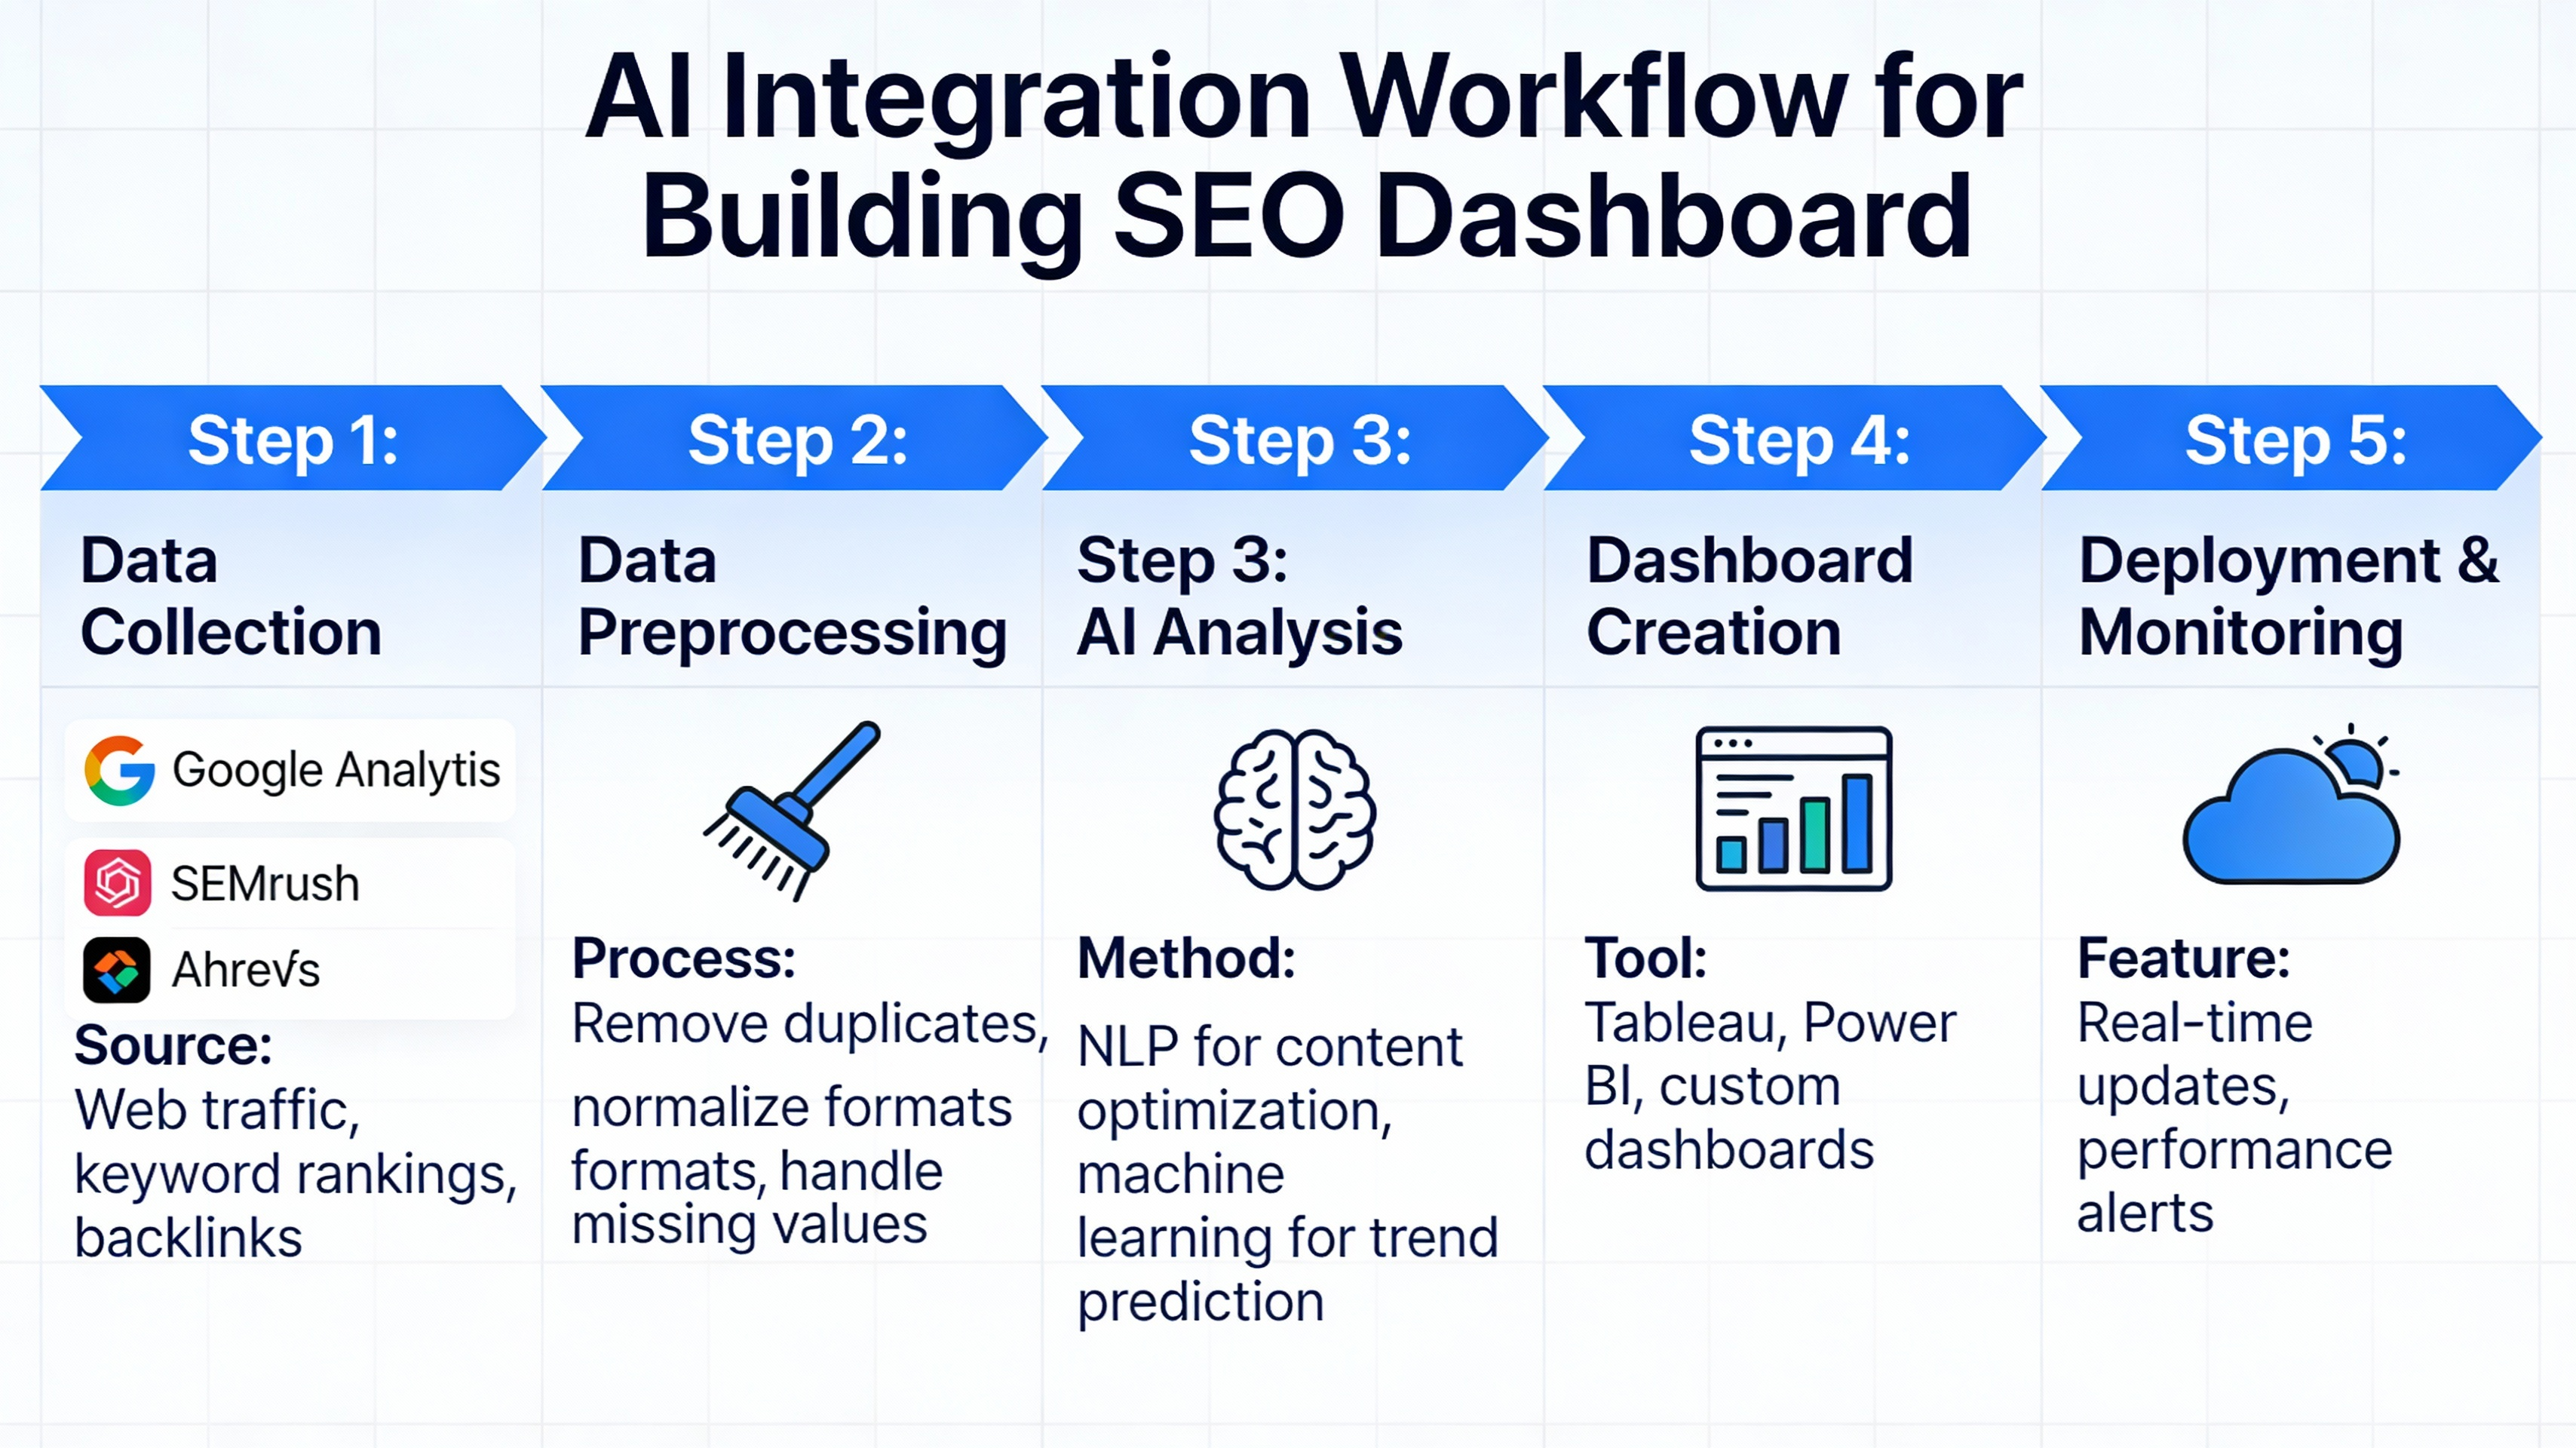
Automation and AI have revolutionized how data is collected, processed, and presented to executive teams. Integrating tools like the Articfly API allows for the seamless flow of keyword and content performance data into your central reporting system. This technical integration reduces manual labor and ensures that the dashboard is always populated with the most recent insights as shown in recent case studies on AI-driven SEO reporting.
The AI data pipeline generally follows this workflow: Data Ingestion (API connections) > AI Processing (Anomaly detection and summarization) > Visualization (Dashboard display) > Alerting (Slack or Email notifications).
Integrating Articfly’s Data APIs
The connection setup for Articfly’s API is designed to be straightforward for teams looking to automate their content performance tracking. By following the Articfly API documentation, developers can pull real-time data on article performance and SEO health directly into BI tools. This integration serves as the engine for a truly dynamic and automated executive dashboard.
Automating Data Collection and Refresh
Scheduling nightly data pulls ensures that stakeholders always have access to fresh information every morning. Automated systems can handle API limits and data cleaning tasks that would otherwise require hours of manual work. This consistency builds trust in the data, as executives know they are looking at a live reflection of the market.
Using AI to Highlight Anomalies
Advanced dashboards use AI to set performance thresholds and automatically generate alerts when significant changes occur. These systems can summarize findings into natural language, explaining why a traffic drop or spike might have happened. This proactive approach allows teams to address issues before they become major problems for the business.
Proving Results Instantly: Reporting and Stakeholder Buy-in

Persuasive executive narratives are built by transforming raw dashboard data into actionable business stories. Utilizing executive summary cards allows you to provide context and highlight the "so what" behind the numbers. Leveraging Articfly’s reporting templates and insights from the Harvard Business Review article on data storytelling helps in crafting messages that resonate with leadership.
Executive Summary Snapshot
- Current Status: Organic revenue is up 15% month-over-month.
- Key Driver: New AI-optimized content clusters are ranking in the top 3 for core keywords.
- Recommendation: Increase investment in the Q3 content calendar to capture rising search demand.
Real-time Alerts and Notifications
Configuring triggers for Slack, email, or SMS ensures that stakeholders are notified the moment a critical threshold is met. These real-time notifications demonstrate that the SEO team is on top of performance fluctuations at all times. This level of transparency fosters a culture of accountability and responsiveness within the organization.
Creating Executive Summaries
Bullet-point cards should be used to provide a high-level overview of performance highlights and upcoming challenges. These summaries should include visual snapshots of the most important charts to reinforce the narrative. Keeping these summaries concise ensures they are actually read and understood by busy executives.
Sharing and Collaboration Features
Modern dashboards include robust export options and permission settings to facilitate easy sharing across the organization. Collaboration features allow stakeholders to comment directly on specific data points, streamlining the feedback loop. This connectivity ensures that SEO data is integrated into broader marketing and sales discussions.
Implementation Checklist & Best Practices
Actionable execution is the final step in moving from a conceptual plan to a functional executive dashboard. Ensuring technical setup is correct and data governance is respected will provide a foundation for long-term reporting success. Referencing the Articfly onboarding guide and GDPR compliance overview will ensure your setup meets both performance and legal standards.
| Action Item | Status | Frequency |
|---|---|---|
| Connect Data Sources (API) | Pending | Once |
| Define OKRs and KPIs | In Progress | Quarterly |
| Set AI Anomaly Thresholds | Pending | Monthly |
| Audit Data Privacy | Pending | Annual |
Technical Setup Steps
The first step involves identifying and integrating all necessary data sources, including Search Console, analytics platforms, and Articfly’s performance data. Establishing these connections through secure APIs is essential for maintaining data integrity and automation. Once the sources are connected, data mapping can begin to ensure all metrics align across platforms.
Data Governance and Privacy
Maintaining high standards for data governance involves outlining clear policies for consent, anonymization, and data retention. It is critical to ensure that all reporting practices remain compliant with global privacy regulations like GDPR. Protecting user data while still extracting valuable insights is a primary responsibility of the modern SEO manager.
Ongoing Optimization
The dashboard itself requires regular maintenance to remain relevant as business goals and search trends evolve. Conducting a quarterly review of tracked metrics ensures the data continues to provide value to the executive team. Additionally, refreshing the AI models used for anomaly detection helps maintain the accuracy of automated insights.
Key Takeaways
- Align SEO with business goals by mapping every search metric to revenue or brand objectives.
- Focus on above-the-fold data to ensure executives see the most critical insights immediately.
- Automate data collection using AI and APIs to provide real-time reporting without manual effort.
- Use AI to highlight anomalies so you can respond to algorithm or market changes instantly.
- Create executive summaries that translate raw data into clear, persuasive business narratives.
FAQ
What data sources can feed an executive SEO dashboard?Typical sources include Google Search Console, Google Analytics, CRM data, and AI performance platforms like Articfly for content-specific insights.
How often should the dashboard refresh for "instant" results?For executive reporting, a daily refresh is standard, while critical anomaly alerts should trigger in near real-time.
Can I use Articfly without a developer?While API integrations may require technical help, Articfly offers user-friendly reporting templates and interfaces designed for non-technical users.
How do I measure ROI without exact revenue numbers?You can use lead valuation estimates or compare organic traffic costs against the equivalent spend in paid search (CPC) to show value.
What are common pitfalls when presenting SEO to executives?The most common errors include focusing on technical jargon instead of business results and overwhelming stakeholders with too much low-level data.
Next steps for executive SEO dashboards
To begin building your high-impact reporting system, consider starting a free trial of Articfly to automate your content performance data. You can also access a downloadable dashboard template to jumpstart your design process. For personalized assistance, schedule a demo to see how AI-powered dashboard setups can transform your reporting.